Open Interest: The Market Signal Traders Miss
What open interest is, how to read it for crypto perps, and how rising or falling OI signals trend strength, reversals, and liquidation risk.
Most traders watch price and volume. Open interest is the third variable — and it tells you something the other two can't: whether new money is entering or leaving the market.
Open interest (OI) measures the total number of outstanding perpetual futures contracts that haven't been closed. Every open long is matched by an open short. When a new buyer and a new seller open positions, OI increases by one contract. When an existing long and existing short close their positions, OI decreases by one contract. When an existing holder passes a position to a new entrant, OI stays flat.
This makes OI a measure of market commitment — the total capital actively deployed in leveraged positions. For Hyperliquid traders, OI data reveals trend strength, liquidation risk, and positioning imbalances that price and volume alone can't show.
How Open Interest Works
OI Changes
OI increases when: A new buyer opens a long AND a new seller opens a short. Both sides are adding fresh positions to the market. This represents new capital entering.
OI decreases when: An existing long closes AND an existing short closes. Both sides are removing positions. This represents capital exiting.
OI stays flat when: An existing long sells to a new buyer (the long passes their position). Or when an existing short buys from a new seller. One side is new, one side is closing — net OI doesn't change.
Key insight: Rising OI means traders are increasing their bets. Falling OI means traders are reducing their bets. This tells you whether a price move is driven by conviction (new positions) or capitulation (closing positions).
OI vs Volume
Volume measures total contracts traded in a period. OI measures total contracts currently open. The distinction matters:
High volume, rising OI: New positions being opened aggressively. Strong conviction behind the current move. Trend likely to continue.
High volume, falling OI: Existing positions being closed aggressively. Capitulation or profit-taking. Trend may be exhausting.
Low volume, flat OI: Quiet market. No strong conviction in either direction. Consolidation or waiting period.
A $1 billion volume day with OI rising $500M means $500M in new positions were opened plus existing positions changed hands. A $1 billion volume day with OI falling $300M means $300M in positions were closed — the market is shrinking, not growing.
Reading OI for Trading Signals
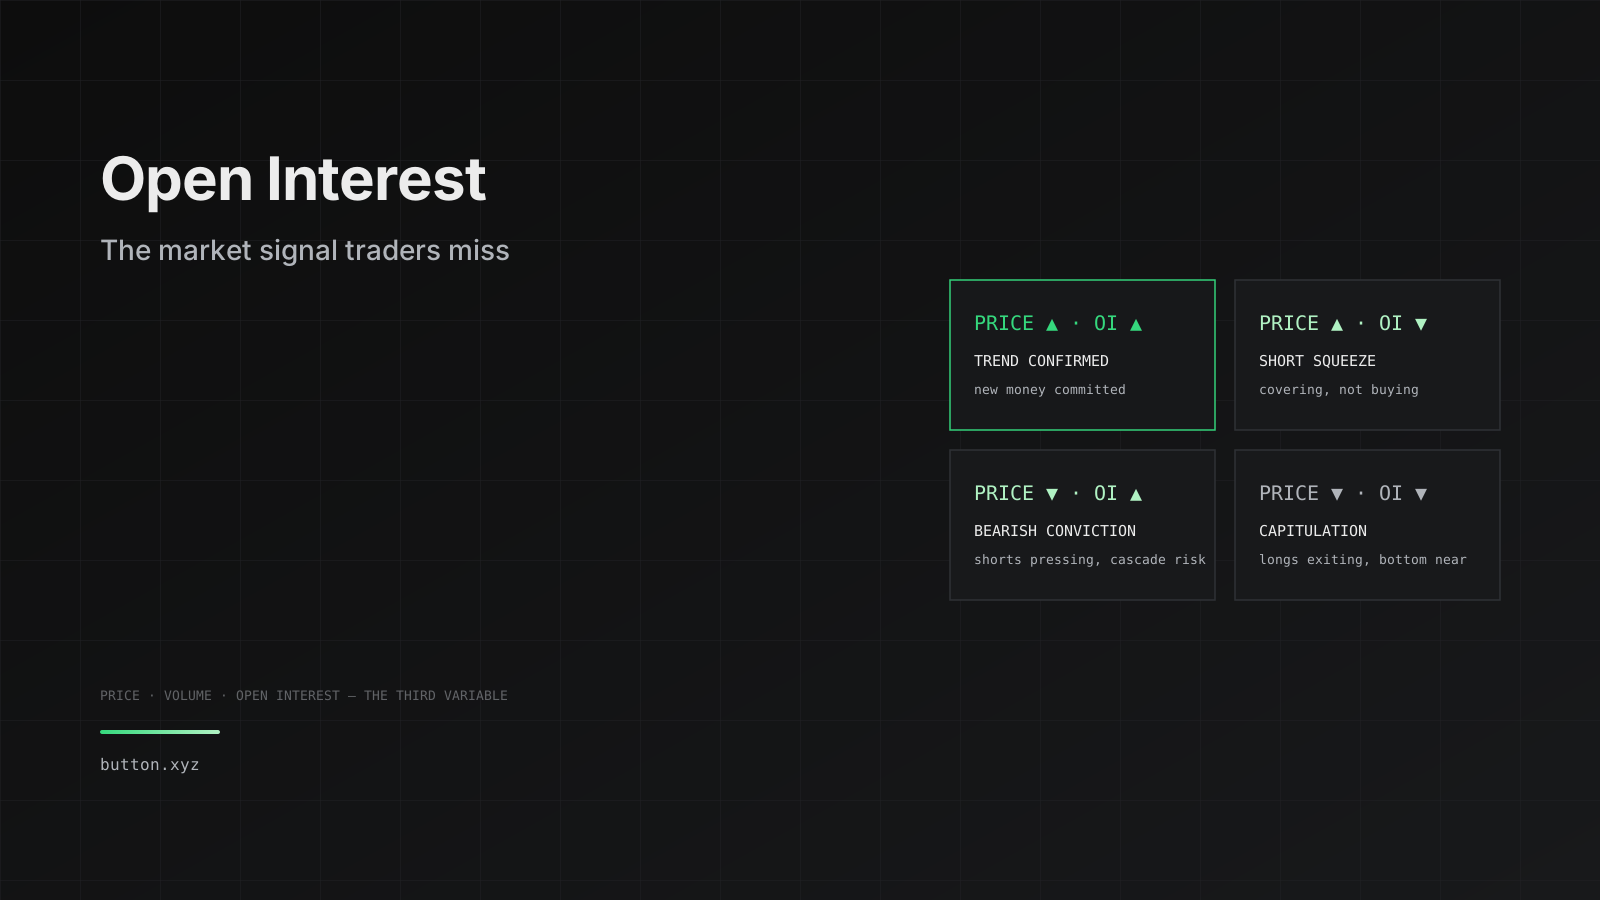
Price Up + OI Up = Trend Confirmation
The strongest bullish signal. Price is rising AND new positions are being opened. This means:
- New longs are entering (buyers with conviction)
- New shorts are entering (sellers who think it's a top — providing fuel for further upside if they're wrong)
- The move is backed by fresh capital, not just position rotation
Trading implication: Trend-following strategies should be fully deployed. Momentum has underlying capital support. The move is less likely to reverse immediately because new money is committed.
On Hyperliquid: Rising BTC OI from $2.5B to $3.0B during a rally means $500M in new leveraged positions entered. If price reverses, those new longs face losses and potential liquidation — creating the potential for a violent unwind. Monitor OI peaks as potential reversal zones.
Price Up + OI Down = Short Squeeze / Weak Rally
Price is rising but OI is falling. This means shorts are closing (buying back their positions) rather than new longs entering. The price increase is driven by short covering, not fresh buying.
Trading implication: This move may have limited upside. Once shorts finish covering, buying pressure evaporates. Look for the rate of OI decline to slow — that indicates most shorts have covered and the move may stall.
Exception: If OI drops after an extreme peak (say from $4B to $3.2B while price rises), the decline may reflect healthy deleveraging. The market is resetting to a more sustainable OI level, which can be bullish long-term.
Price Down + OI Up = Trend Confirmation (Bearish)
The bearish equivalent of the first signal. Price is dropping AND new positions are being opened — new shorts entering with conviction, plus new longs (who are about to suffer).
Trading implication: Bearish momentum has capital support. Short strategies should be active. The risk: rising OI during a decline means increasing long liquidation risk. If OI spikes into a sharp decline, expect liquidation cascades.
Price Down + OI Down = Long Capitulation
Longs are closing (selling) as price drops. The decline is driven by existing holders exiting, not new shorts piling in. This is often the final phase of a selloff.
Trading implication: Potential bottom signal. When OI drops sharply alongside price, the leveraged longs who were going to sell have sold. Once the forced selling exhausts, price can stabilize. Watch for OI to flatten while price stabilizes — that's the capitulation bottom.
OI as a Liquidation Risk Indicator
The OI-Liquidation Connection
High OI means high aggregate leverage. When OI reaches extreme levels relative to market cap, the market is over-leveraged — a price move in either direction will trigger mass liquidations.
BTC OI/market cap ratio:
- Below 2%: Low leverage. Price moves are likely organic, driven by spot demand. Liquidation cascades unlikely.
- 2-3%: Normal leverage. Market functioning normally. Standard liquidation risk.
- 3-4%: Elevated leverage. Large positions are concentrated. A 5-10% price move will trigger significant liquidations.
- Above 4%: Extreme leverage. The market is a powder keg. A sharp move in either direction cascades through liquidations.
Practical use: When aggregate OI across exchanges hits extreme levels, reduce your own leverage. You don't want to be caught in a liquidation cascade triggered by other traders' over-leveraged positions.
OI Distribution Across Exchanges
OI isn't evenly distributed. Hyperliquid might have $3B in BTC OI while Binance has $8B. A liquidation event on Binance (which has more concentrated OI) can cascade across all exchanges via arbitrage and panic.
Monitor total cross-exchange OI, not just the exchange you're trading on. A Binance liquidation cascade will drag Hyperliquid prices along with it.
OI on Hyperliquid
Current OI Landscape
Hyperliquid's OI has grown from $500M in early 2024 to $3B+ in 2025, reflecting the platform's rapid adoption. BTC and ETH account for approximately 60% of total OI, with the remaining 40% spread across 100+ altcoin pairs.
By pair category:
- BTC: $1.0-1.5B OI (deepest, most institutional)
- ETH: $600M-$1B OI
- SOL: $200-400M OI
- Mid-cap alts (ARB, AVAX, DOGE): $50-200M each
- Long-tail alts: $5-50M each
OI and Funding Rate Relationship
OI and funding rate are connected but distinct. High OI doesn't automatically mean high funding. OI measures total positions; funding measures directional imbalance.
High OI + high positive funding: Market is leveraged AND directionally biased long. Maximum long liquidation risk. Carry traders earn elevated funding income.
High OI + near-zero funding: Market is leveraged but balanced. Both sides are roughly equal. A move in either direction triggers cascading liquidations — the question is which side.
Low OI + any funding rate: Market is lightly leveraged. Liquidation risk is minimal. Price moves are likely organic. Less opportunity for carry trades (less capital generating funding payments).
Using OI for Hyperliquid Strategies
Grid trading: High OI + range-bound price = ideal grid conditions. Lots of leveraged positions churning without breaking the range. Each grid fill captures the maker rebate (-0.02%) and the grid spreads earn on the trapped volume.
Carry trades: Monitor OI trends alongside funding rates. Rising OI + rising funding = increasing carry opportunity. Deploy more capital to the carry strategy. Falling OI + compressing funding = carry yields declining. Reduce carry allocation.
Liquidation avoidance: When total Hyperliquid OI spikes 20%+ in a week, the market is getting over-leveraged. Reduce your own leverage and widen stops. The cascade, when it comes, will be proportional to the OI buildup.
Advanced OI Analysis
OI Heatmaps
OI aggregated by liquidation price creates a "heatmap" showing where large clusters of liquidations sit. If $500M in long liquidations are clustered around $62,000 BTC, a move to $62,000 becomes a gravity well — once price approaches, liquidations start triggering, creating selling pressure that pushes price further down, triggering more liquidations.
Trading application: Avoid holding positions that would be liquidated in the same zone as large OI clusters. Your liquidation price should be outside the major clusters, not in the middle of them.
OI by Timeframe
Short-term OI changes (hourly, daily) reveal positioning shifts. Long-term OI trends (weekly, monthly) reveal market structure:
Rising long-term OI trend: The market is growing. More capital is entering the perpetual futures space. This is structurally bullish for trading opportunities (more volume, better liquidity, more funding).
Declining long-term OI trend: Capital is leaving. This happens during prolonged bear markets and after major blow-ups (FTX collapse caused a sustained OI decline across all exchanges). Fewer opportunities, thinner liquidity.
Cross-Asset OI Signals
When BTC OI spikes but altcoin OI is flat, the positioning is concentrated in BTC. This is typically institutional or large-trader driven. When altcoin OI spikes while BTC is flat, retail speculation is driving the market — this is historically a late-cycle signal.
Monitor the OI ratio between BTC and total market OI. When BTC's share drops below 30% (meaning alts represent 70%+ of OI), the market is in peak speculation mode. Historically, these periods end with sharp corrections in the over-leveraged alts.
FAQ
Where can I see open interest data?
On the Hyperliquid trading interface, OI is displayed per pair. For cross-exchange aggregate OI, platforms like Coinglass and Laevitas provide real-time tracking. The Hyperliquid API provides programmatic access to OI data for bots and dashboards.
Does high open interest mean bullish or bearish?
Neither by itself. High OI means high leverage — a lot of money is committed to positions. The direction of the next big move depends on where the OI is concentrated (longs vs shorts) and what triggers it. High OI amplifies moves in both directions.
What's the relationship between OI and liquidity?
More OI generally means more liquidity (more resting orders from position management). But extreme OI can reduce effective liquidity during a cascade — when everyone tries to exit simultaneously, the order book can't absorb the volume.
How often should I check OI?
For position monitoring: daily. For entry/exit timing: check before opening a new position. For risk management: set alerts on OI crossing extreme thresholds (relative to 30-day average).
Can I trade based on OI alone?
OI alone isn't a trading signal — it's context for other signals. "Price broke resistance" is stronger when combined with "OI is rising" (confirming new money backs the breakout) versus "OI is falling" (suggesting the breakout is driven by short covering and may not sustain).
Add OI to Your Edge
Price tells you where the market is. Volume tells you how active it is. Open interest tells you how committed it is. The three together give you the full picture — and OI is the one most traders ignore, which is exactly why it still works as an edge.
Run data-driven strategies with the agent: the AI trading agent monitors open interest, funding rates, and order book data across Hyperliquid — using OI signals for regime detection, liquidation risk assessment, and position sizing in carry, grid, and directional strategies.
Related: Funding rate for the companion signal. Funding rate arbitrage for turning OI and funding into carry income. Perpetual futures for the mechanics behind every open contract.