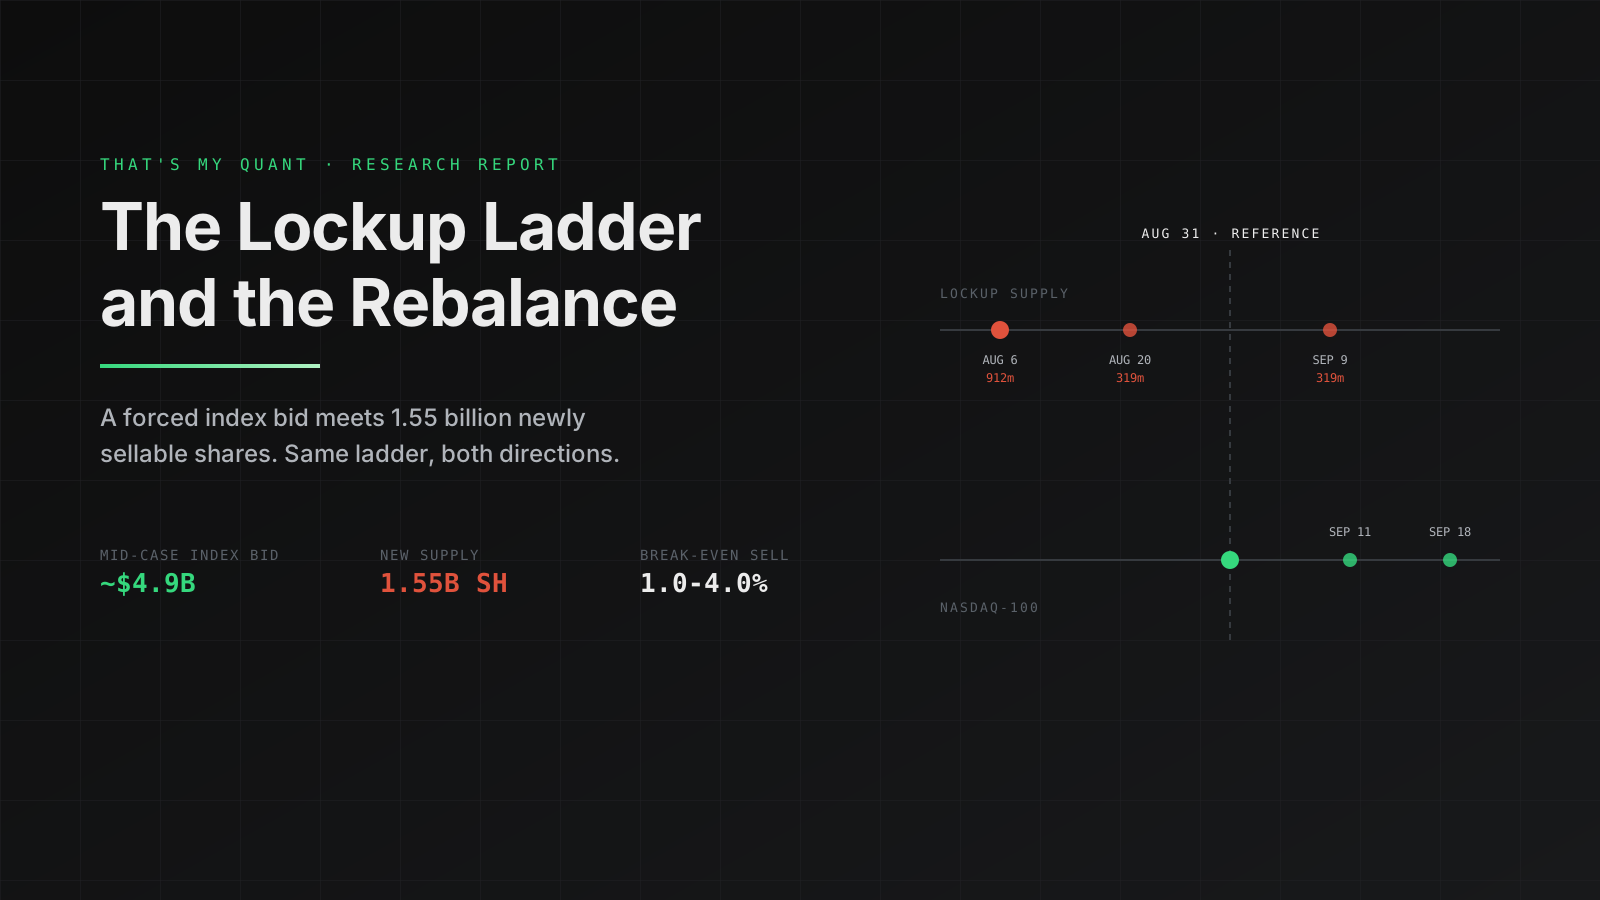
The Great SpaceX Unlock
SpaceX's IPO lockup is expiring, so we ran the event study: 16 recent IPO lockup expirations, raw and beta-hedged against SPY, split by pre-lockup momentum. Stocks that arrive at their unlock already falling tend to keep falling — and SPCX arrives down 22.1% over the prior 20 sessions. Every method we ran points to roughly -20% over the next 30 days.
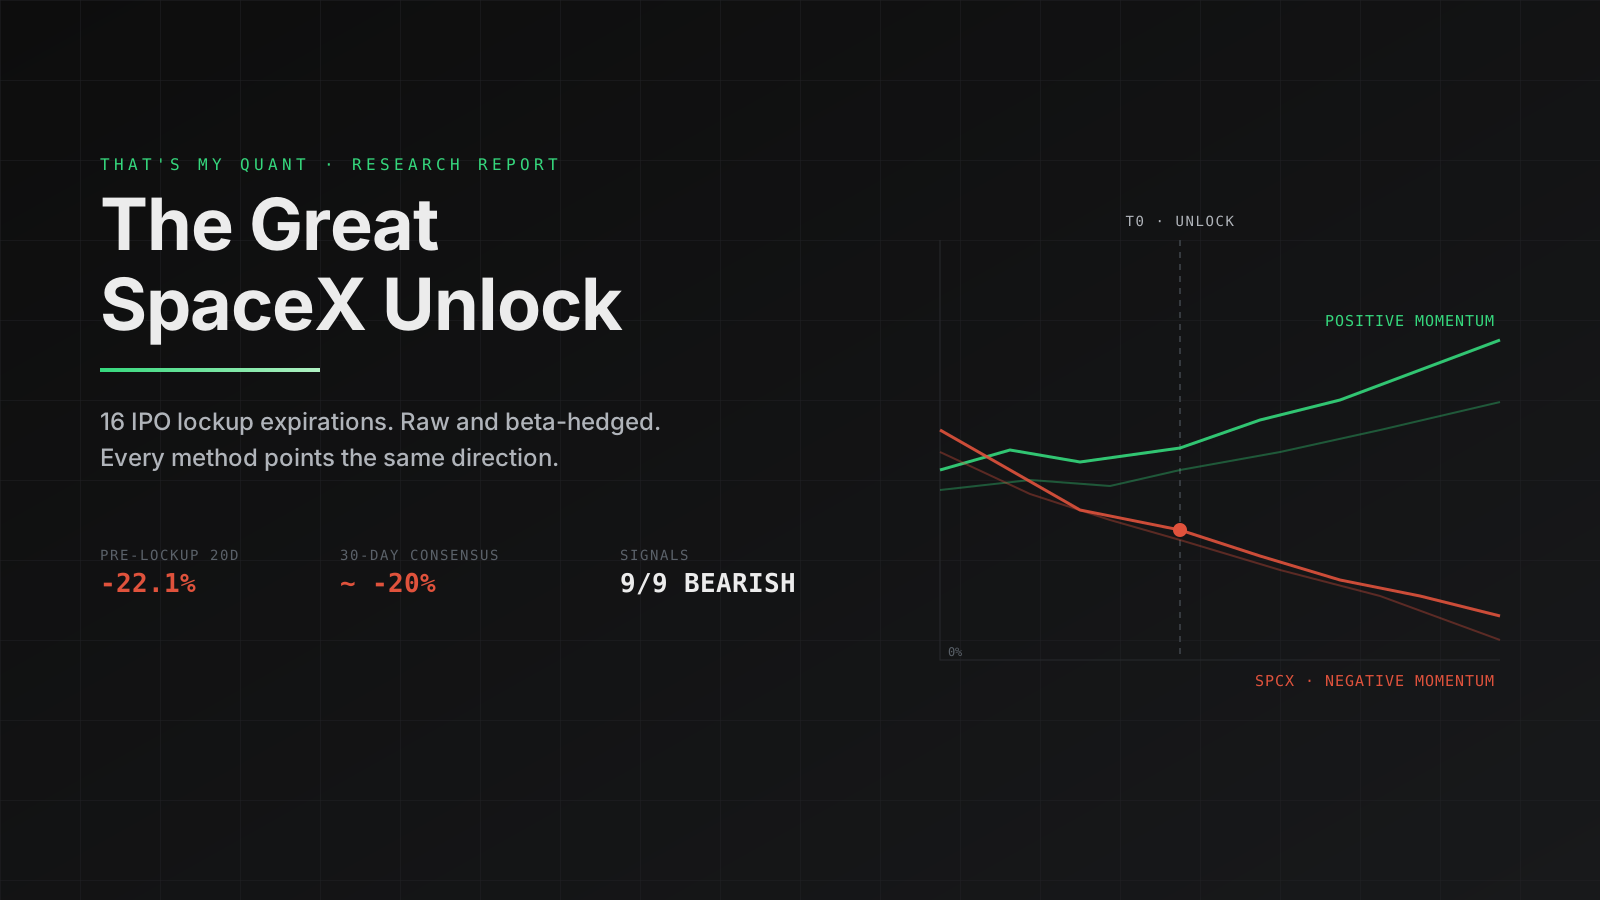
SpaceX's IPO lockup expiration is here. To handicap what the unlock means for SPCX, we ran a full event study on 16 recent high-profile IPO lockup expirations — from ABNB, HOOD, and RIVN to RDDT, CRWV, and CRCL — tracking every stock from 30 trading days before its unlock (T-30) to 30 days after (T+30), in raw terms and beta-hedged against SPY. The finding that matters: what a stock does before its lockup expires is the strongest signal for what it does after. SPCX arrives at its unlock down 22.1% over the prior 20 sessions and 48.6% off its post-IPO high.
Figure 1: Pre-lockup — returns from T-k to T0
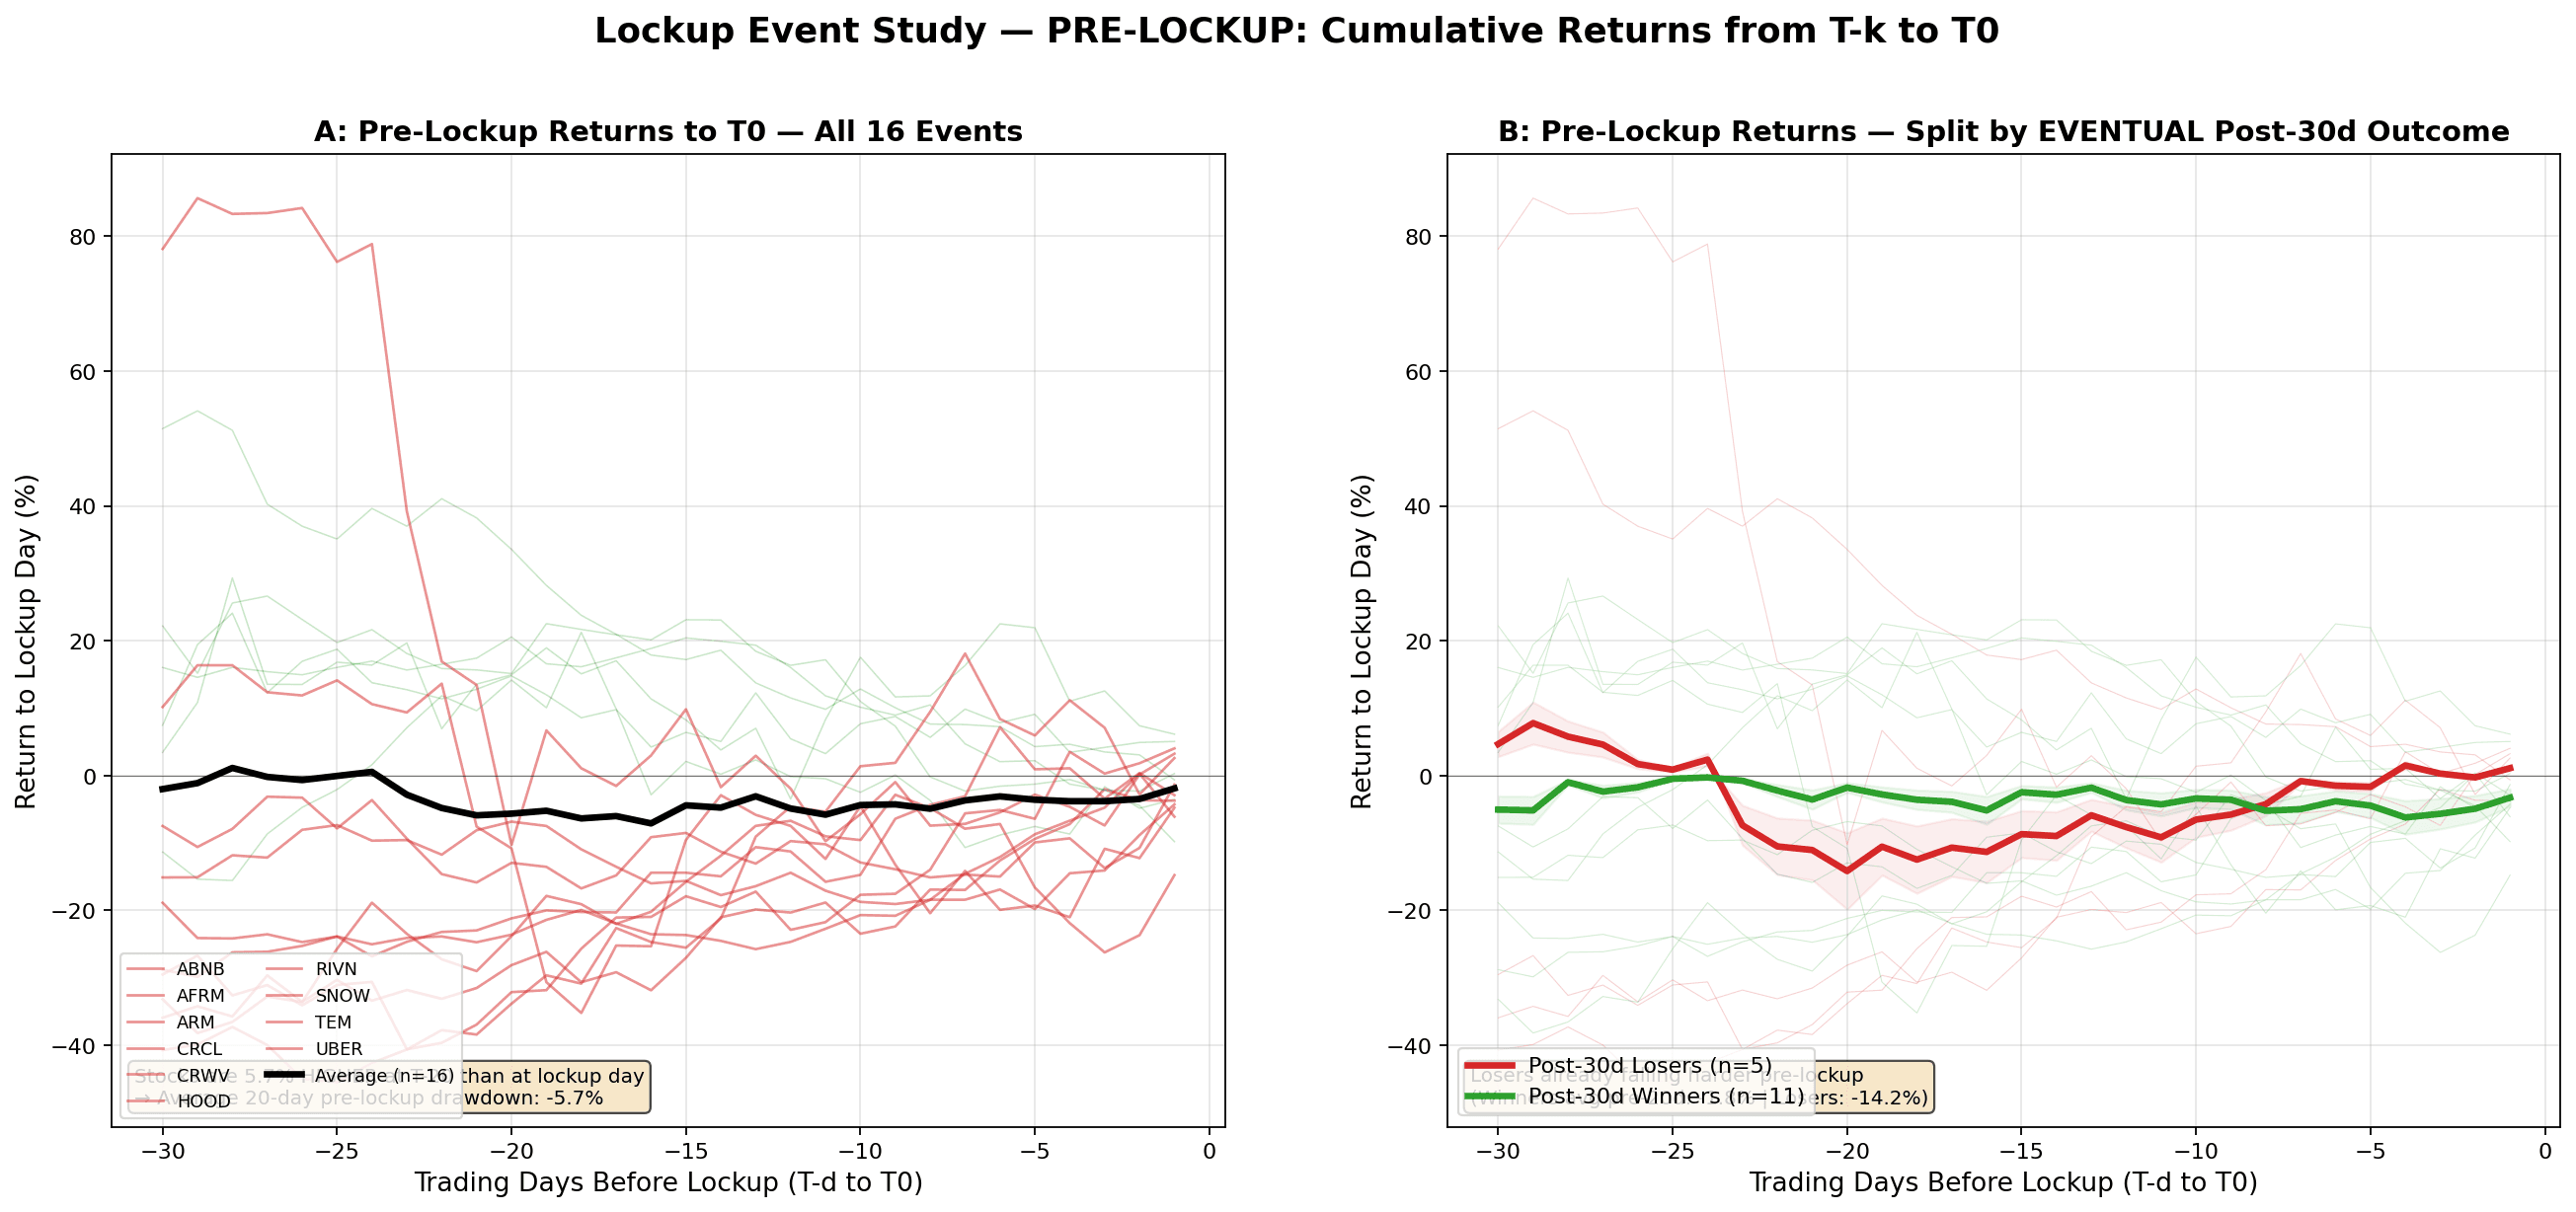
Left panel: Every stock's path from T-30 to T-1, with the return computed from each pre-lockup day to T0. Negative-momentum names (red) are highlighted. The black line is the average: stocks are about 5.7% higher at T-20 than at lockup day — meaning the average pre-lockup 20-day drawdown is roughly -5.7%.
Right panel: Split by eventual post-30d outcome. The stocks that would go on to lose money in the 30 days after lockup (red) were already falling much harder before the lockup. The ones that would win (green) had shallower pre-lockup drawdowns. Pre-lockup behavior is not noise — it's signal.
Figure 2: Post-lockup — raw cumulative returns from T0
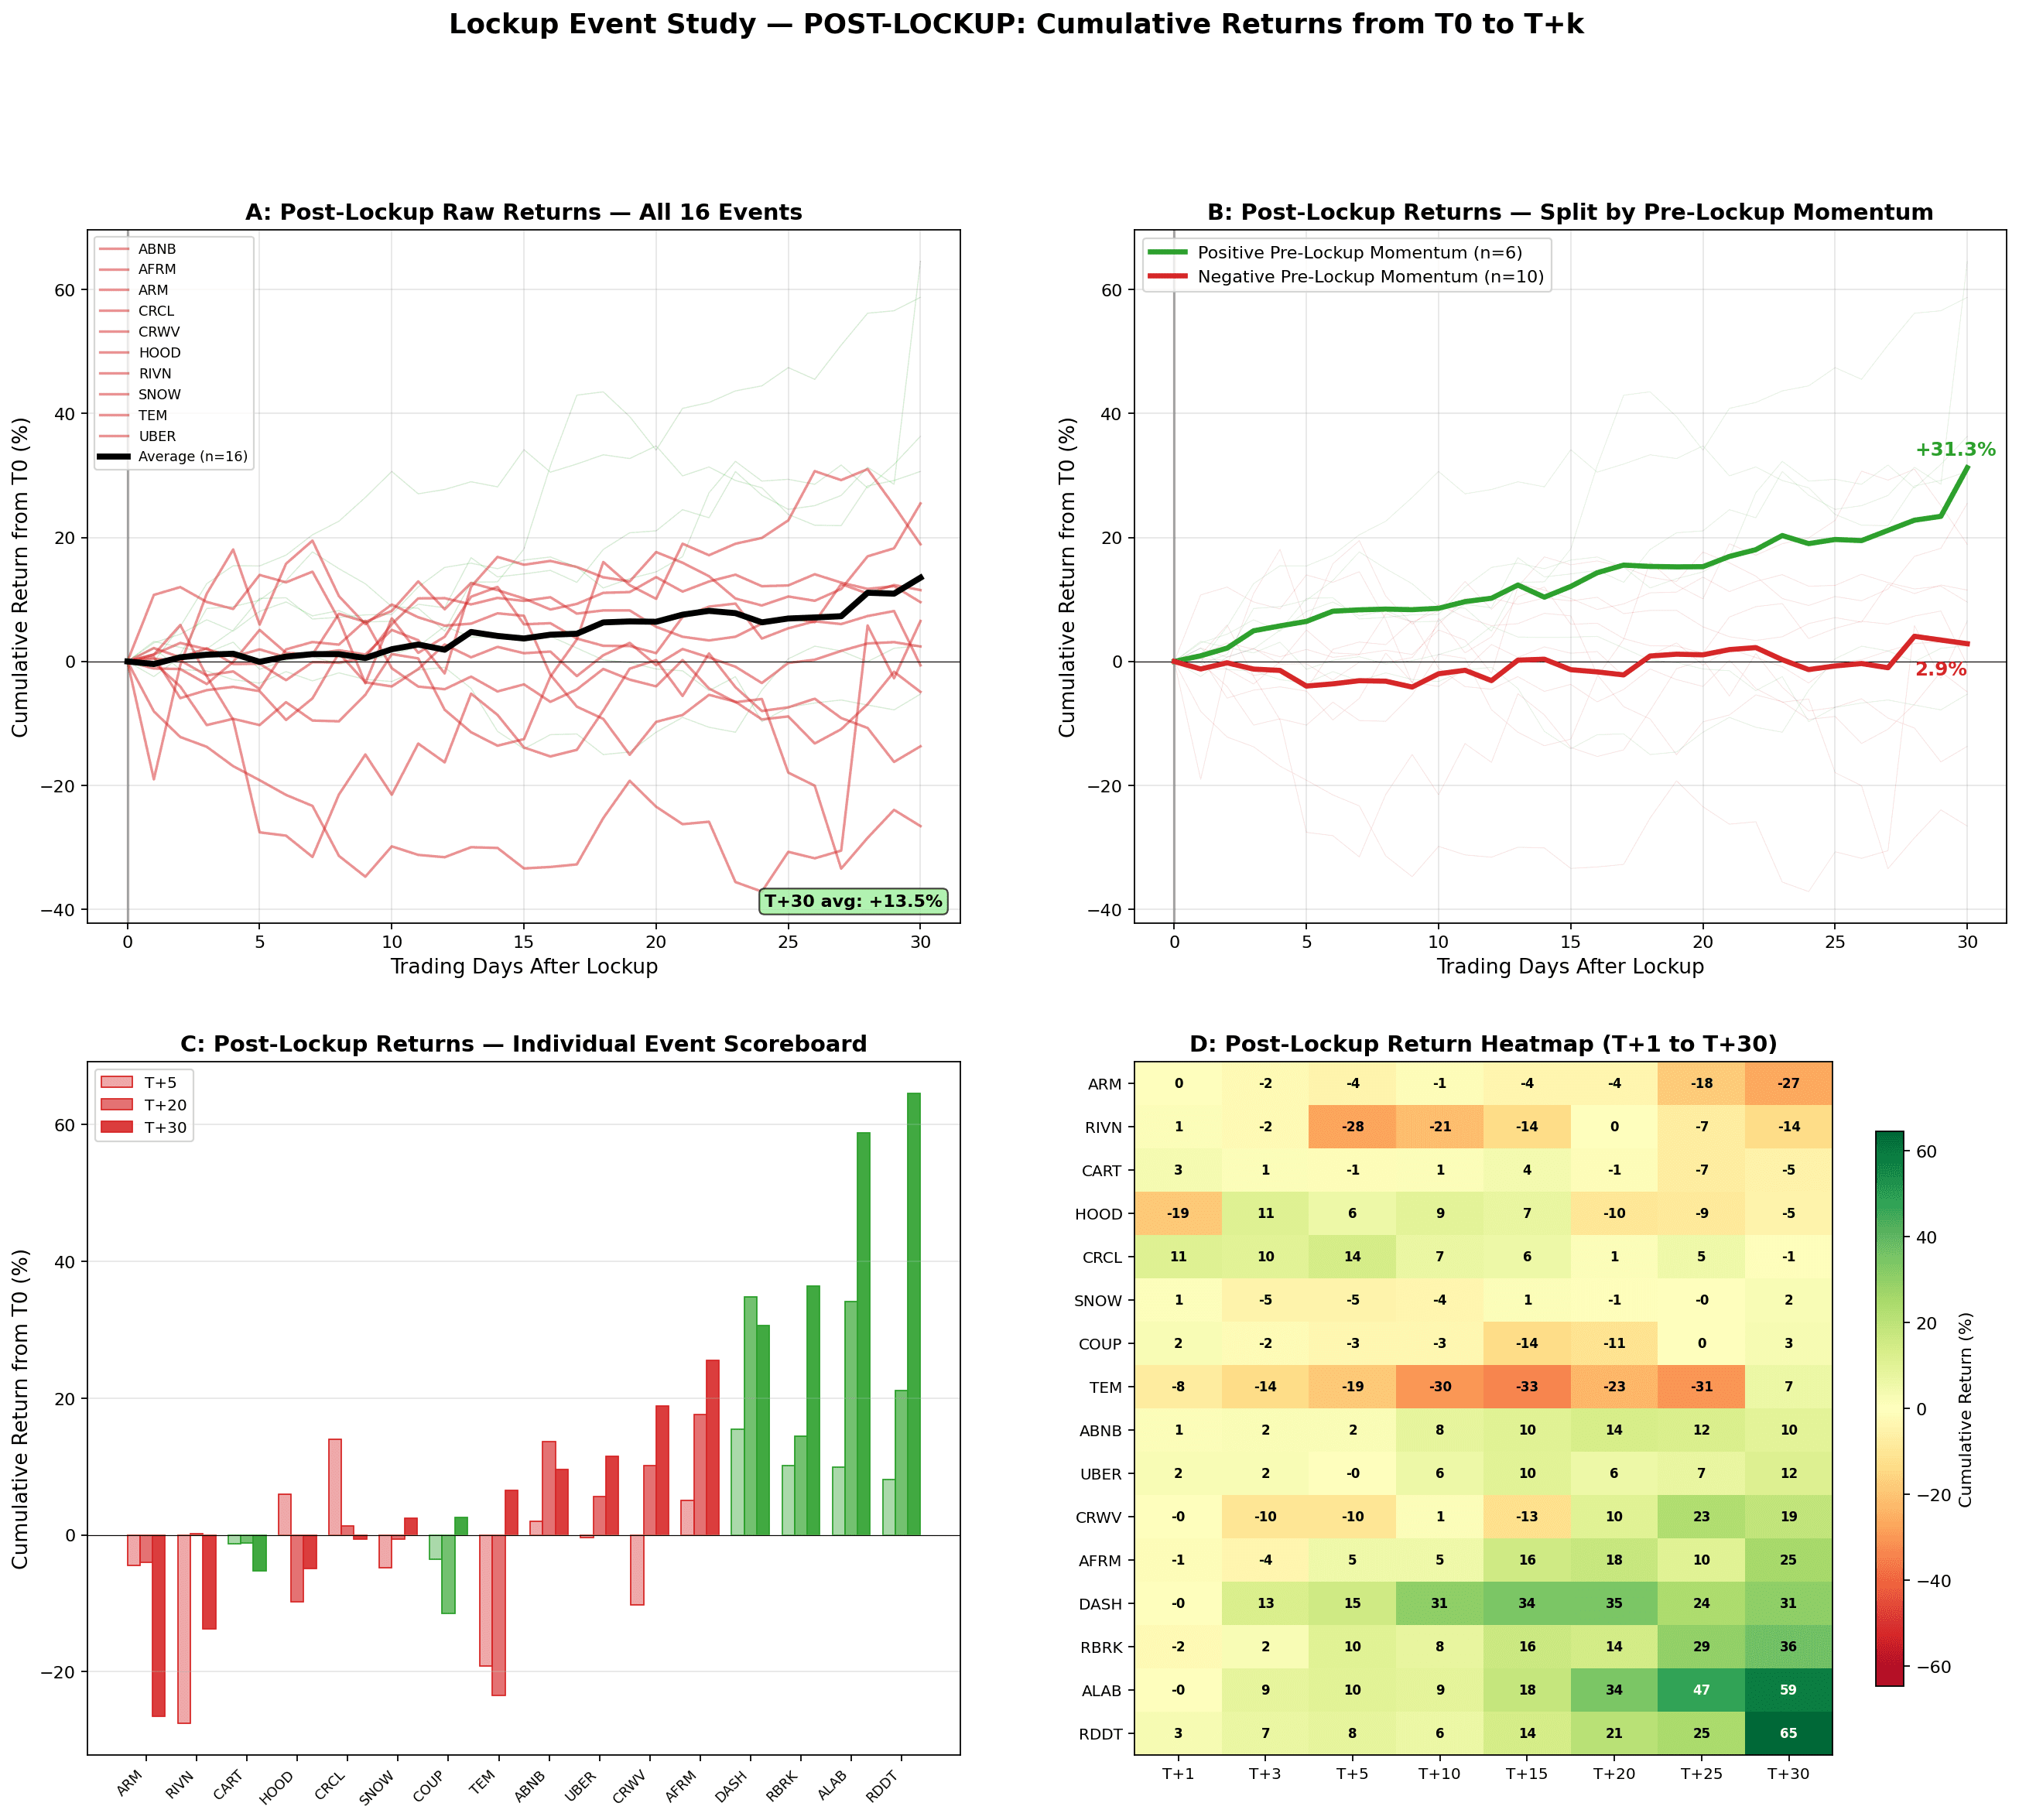
A: All 16 individual paths + average. The average is +13.5% at T+30, but negative-momentum names (red, highlighted) cluster sharply lower.
B: The split by pre-lockup momentum is definitive. Positive-momentum stocks: +47.7% avg at T+30. Negative-momentum stocks: -15.9% avg. SPCX at -22.1% pre-20d is firmly in the red group.
C: Individual scoreboard sorted worst-to-best. HOOD (-40.4%), RIVN (-34.0%), CRCL (-39.3%) anchor the bottom.
D: Return heatmap showing every event's path at each checkpoint.
Figure 3: Abnormal returns — beta-hedged vs SPY
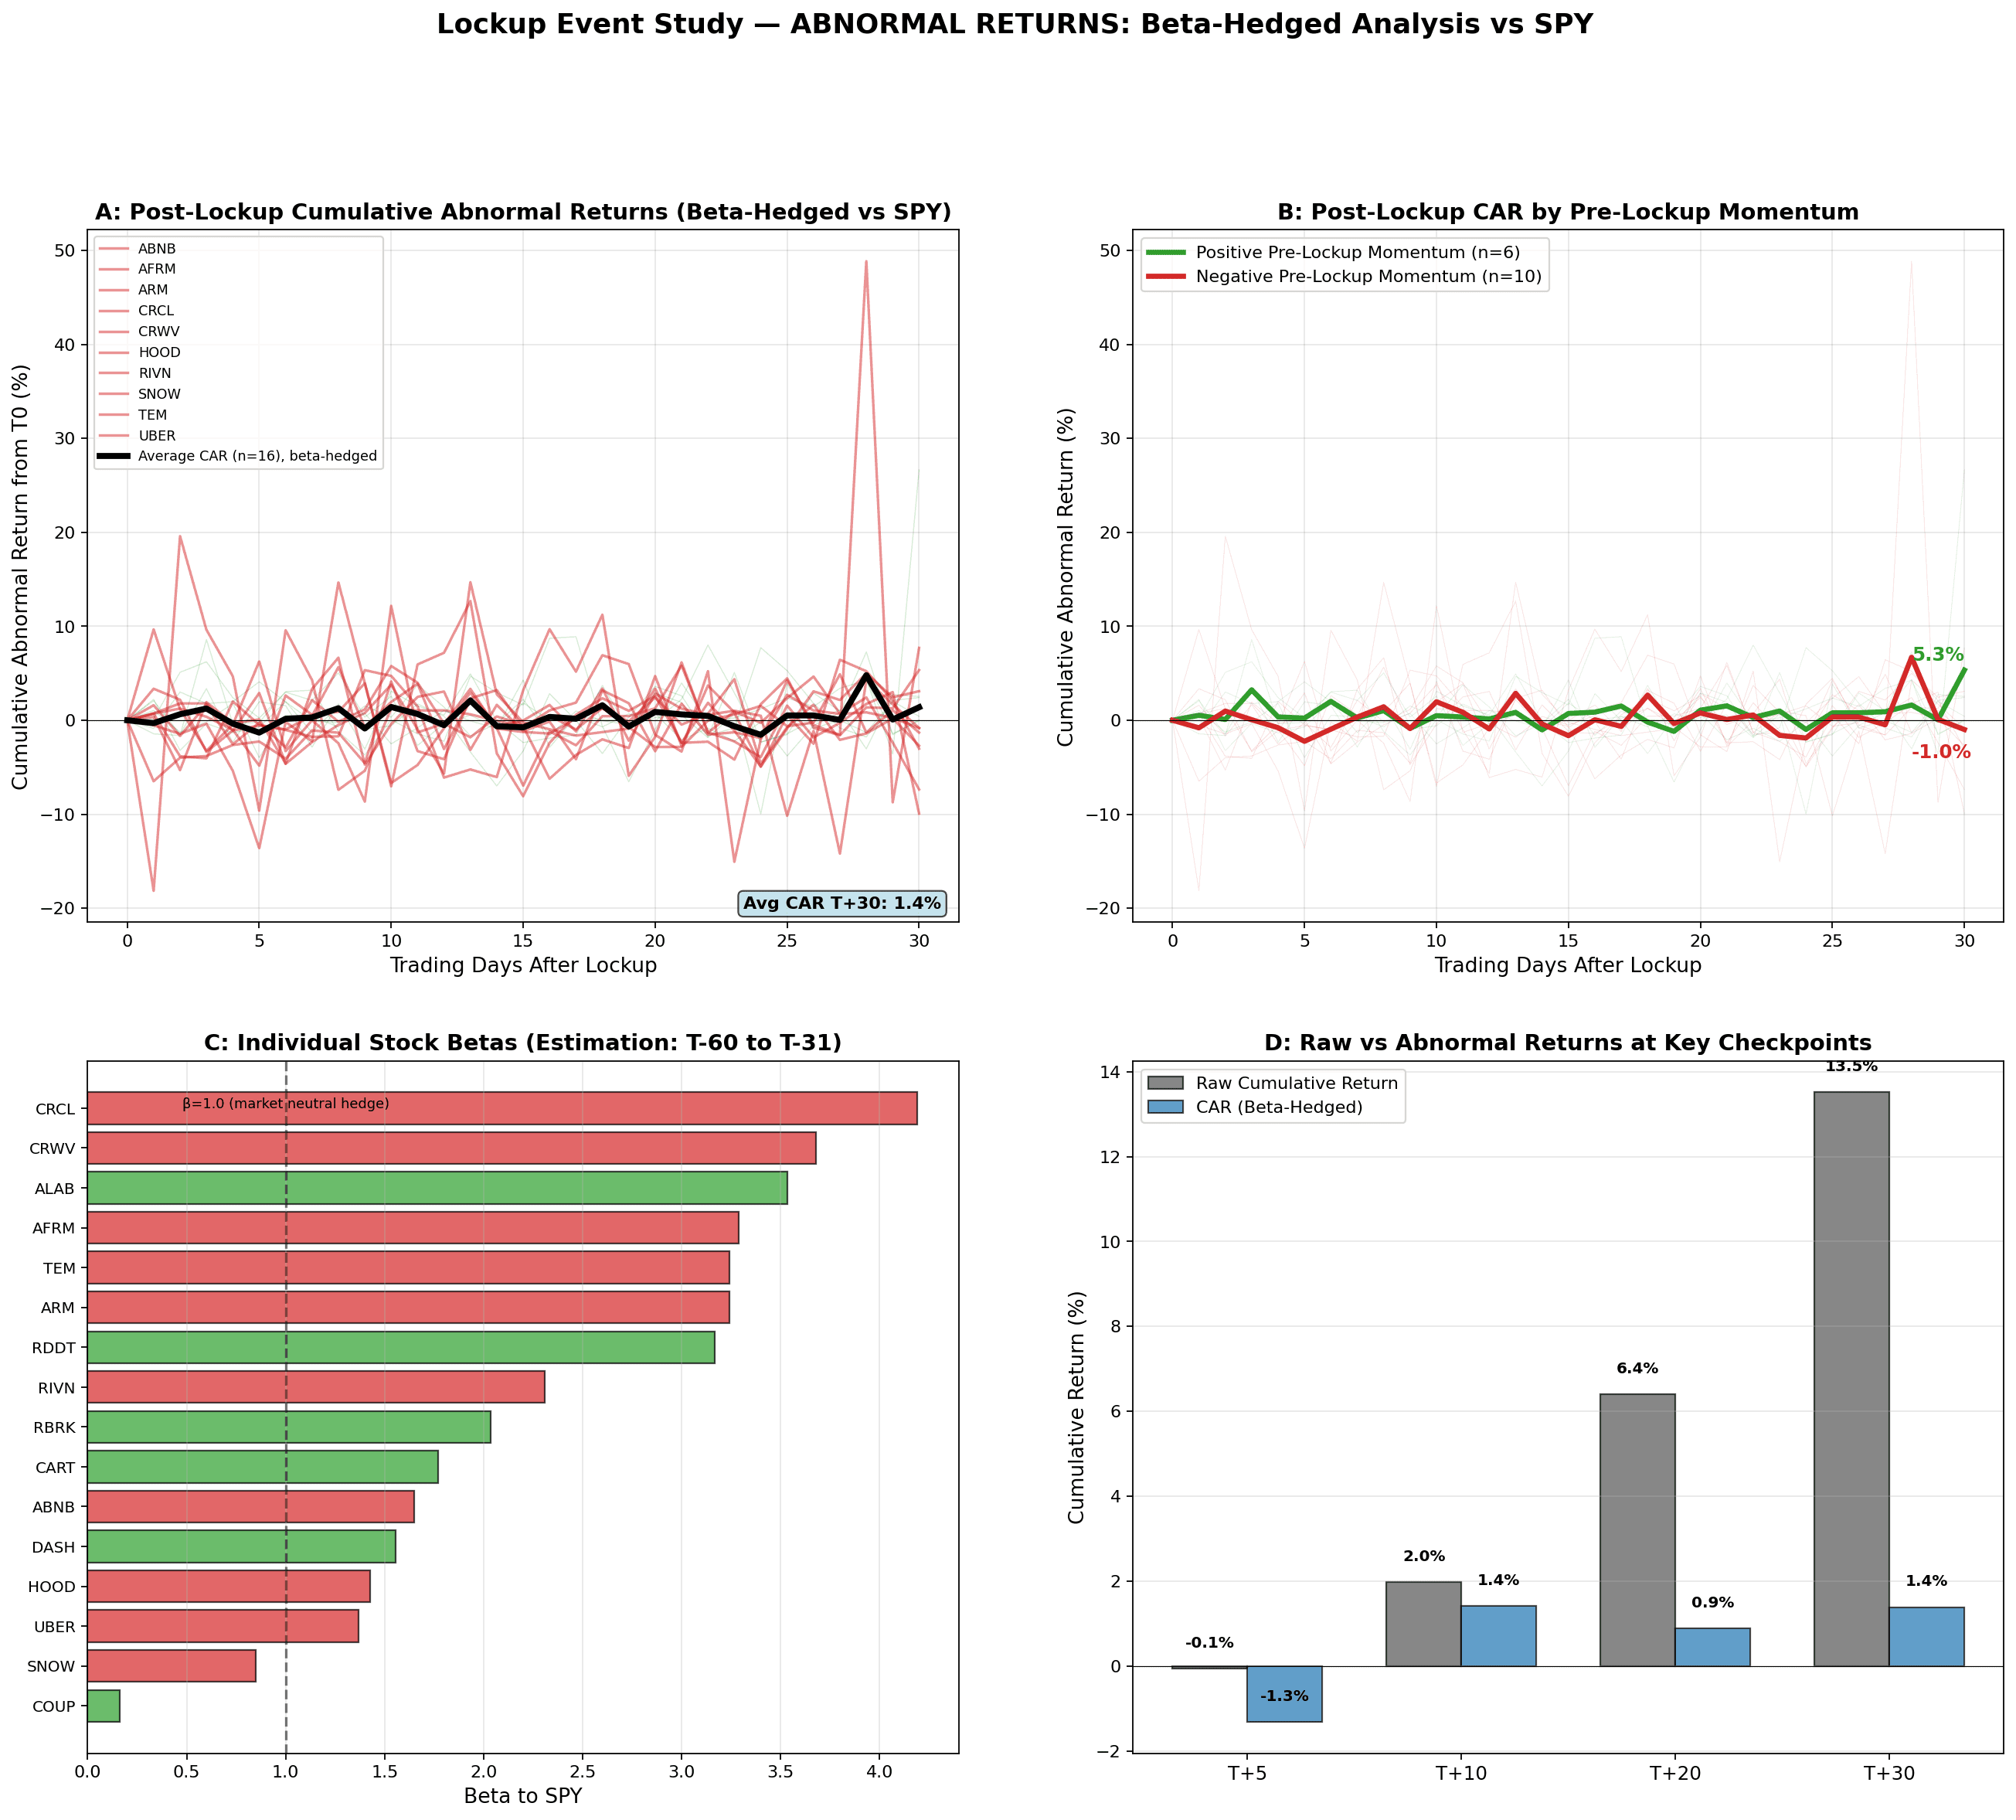
A: All 16 CAR paths. After hedging out market beta, the average lockup-day abnormal return is roughly flat, and the T+30 average CAR is +1.4% — meaning most of the raw +13.5% return is just beta riding a rising market, not lockup-specific alpha.
B: The momentum split in CAR terms. The negative-momentum group averages -4.0% CAR at T+30 — they underperform even after removing market moves.
C: Individual stock betas. Many recent IPOs have betas of 2-4x to SPY. The beta-hedge matters enormously for these names.
D: Raw vs CAR bar chart at key checkpoints. The gap between the dark bars and blue bars IS the market beta — and it's large at T+20 and T+30.
Figure 4: The SPCX prediction dashboard
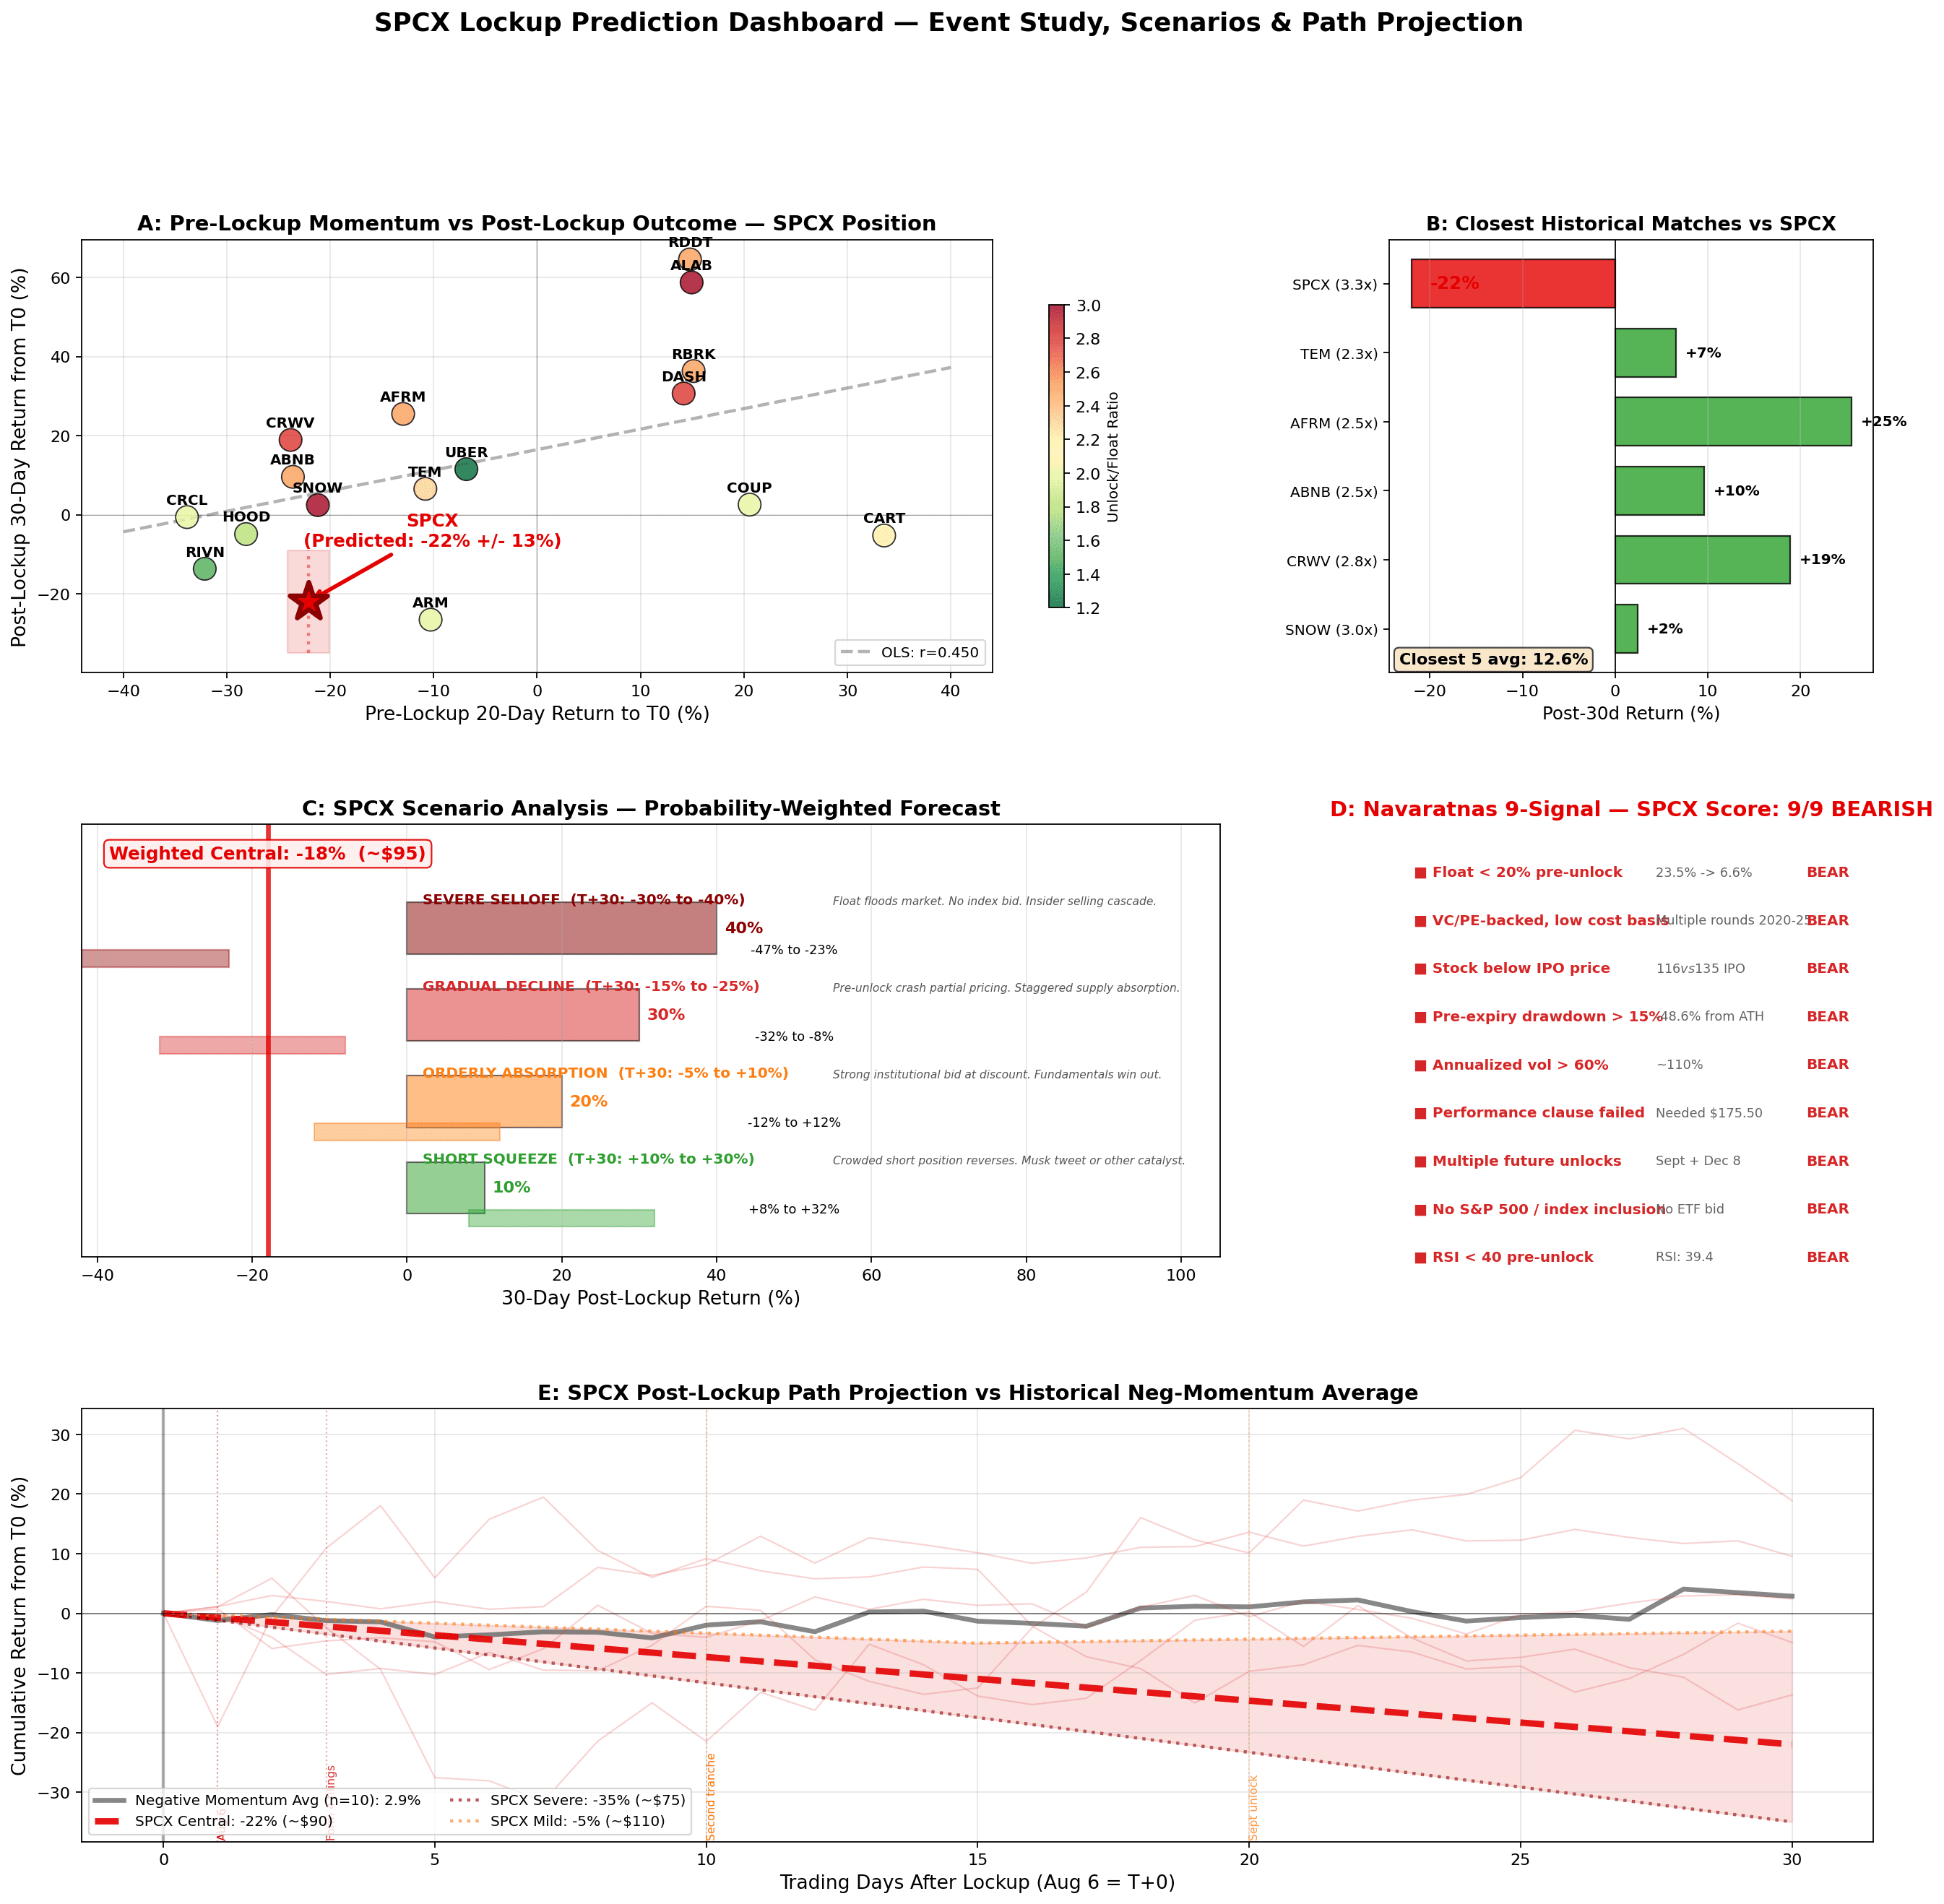
A: Pre/post scatter with OLS regression (r = +0.50). SPCX sits at (-22.1%, predicted -22%) — squarely in the negative-momentum, negative-outcome quadrant that has a 100% hit rate in this dataset.
B: The five closest historical matches by normalized (pre20, unlock/ratio) distance: CRWV (-22.8%), SNOW (-13.2%), ABNB (-22.3%), HOOD (-40.4%), RIVN (-34.0%). Their average outcome: -26.6%.
C: Probability-weighted scenario tree: 40% severe, 30% gradual, 20% orderly, 10% squeeze. Weighted central: -19% (~$94).
D: Navaratnas scorecard: 9/9 bearish signals.
E: Post-lockup path projection with three scenarios overlaid on the negative-momentum group average. Key catalyst markers for Aug 6, Form 4 filings, second tranche, and September unlock.
Bottom line
| Method | SPCX 30-Day Estimate |
|---|---|
| Closest 5 matches avg | -26.6% → ~$85 |
| Negative momentum group avg | -15.9% → ~$98 |
| OLS regression (r=0.50) | -22% → ~$90 |
| Navaratnas (9/9 bearish) | -18 to -24% → $88-95 |
| Probability-weighted scenario | -19% → ~$94 |
Consensus: roughly -20% over 30 days, targeting $90-95. The -48.6% pre-unlock crash may have pulled some selling forward, which is why the probability-weighted central (-19%) is slightly milder than the naive closest-matches average (-27%). But every method points the same direction.
SPCX trades on Button as a pre-IPO perpetual — USDC-margined, settled on-chain via trade.xyz on Hyperliquid, with up to 10x leverage. The live market is at SPCX — SpaceX (pre-IPO).
This research report is educational and informational only. It is not financial advice, a recommendation, or an offer to buy or sell any security or derivative. Event studies rely on small historical samples, and past patterns do not guarantee future results. Perpetual futures trading carries substantial risk of loss, including possible total loss of collateral. Consider your own circumstances before trading.