The Risks You Really Own
Ten stocks, three ETFs, several crypto assets, and a few options positions can look diversified — and still be one large bet wearing different ticker symbols. Risk factors reveal what your portfolio really owns.
You may own ten stocks, three ETFs, several crypto assets, and a few options positions. That looks diversified. But if those positions rise and fall for the same underlying reason, you may own one large bet wearing different ticker symbols. That hidden layer is where risk factors live.
A risk factor is a common force that causes different investments to move together. An asset tells you what you own. A risk factor tells you why it may gain or lose value. For example:
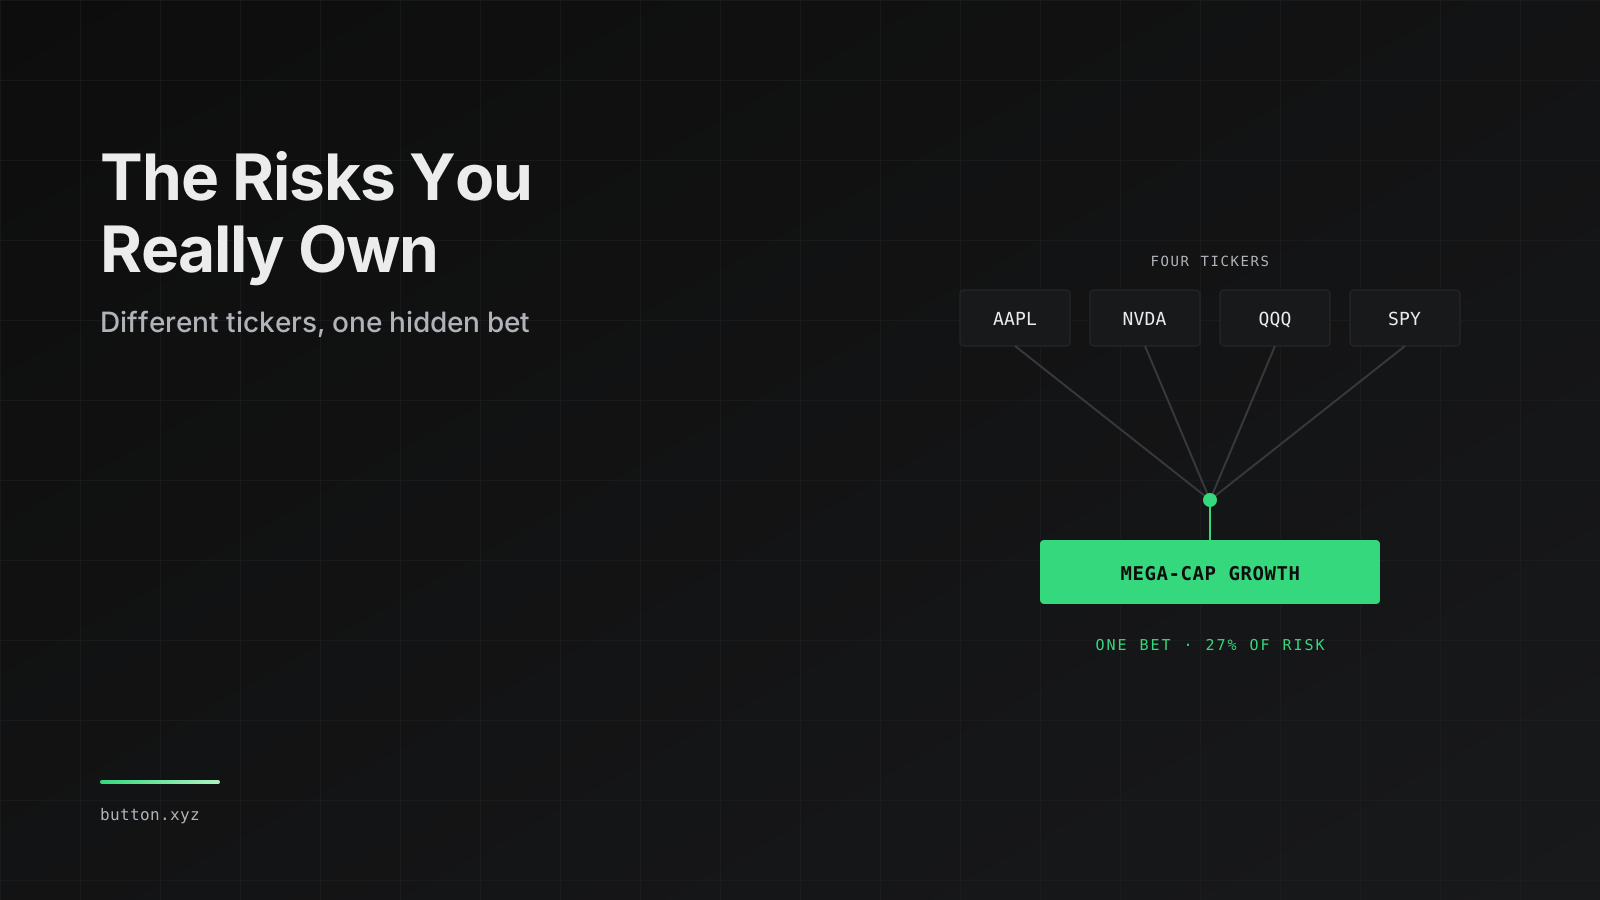
- AAPL, NVDA, QQQ and SPY → Equity beta, mega-cap growth, technology and interest-rate risk
- Growth stocks and long-duration bonds → Shared sensitivity to interest rates
- BTC, ETH, SOL and long perpetuals → Crypto beta, leverage, funding and liquidity risk
- Calls, puts and option spreads → Delta, gamma, vega, theta, skew and expiration risk
- International equities → Equity, currency, country and geopolitical risk
Different assets do not always mean different risks.
Exposure is not the same as risk contribution
Two measurements matter. Factor exposure measures how sensitive the portfolio is to a factor. Risk contribution estimates how much of the portfolio's total risk comes from that factor. A small exposure can contribute significant risk when the factor is volatile. A large exposure may contribute less risk when another position offsets it.
A simplified model is:
Portfolio return = alpha + factor exposure × factor return + position-specific returnPortfolio risk can then be separated into:
Total portfolio risk = shared factor risk + position-specific riskThe purpose of the math is to answer practical questions:
- What is driving my portfolio?
- Which positions create that exposure?
- How much risk comes from it?
- What could happen during stress?
- What changes if I reduce it?
- What return or upside might I give up?
A useful risk product should not stop at:
You have technology exposure.
It should explain:
Mega-cap growth contributes an estimated 27% of your portfolio risk. Most of it comes from NVDA, AAPL, and overlapping exposure inside QQQ and SPY.
Now the investor understands the risk, its size, and its source.
Risk exists across every asset class
Equity portfolios can be exposed to:
- Broad market beta
- Growth and value
- Momentum
- Company size
- Sector concentration
- Interest rates
- Individual-company events
Crypto portfolios can be exposed to:
- Broad crypto-market beta
- BTC or altcoin concentration
- Leverage and liquidations
- Funding rates and futures basis
- Stablecoin risk
- Exchange and custody risk
- On-chain liquidity and slippage
Options portfolios can be exposed to:
- Delta
- Gamma
- Vega
- Theta
- Volatility skew
- Expiration concentration
- Large nonlinear losses during market gaps
The right model depends on the portfolio. A long-term equity account, a leveraged crypto portfolio, and a short-volatility options strategy should not be analyzed with identical assumptions.
Risk is not automatically bad
A large exposure may be intentional. If you believe semiconductor demand is underpriced, semiconductor exposure may be part of your thesis. If you sell options to earn volatility premium, short-volatility exposure may be intentional. If you expect crypto adoption to accelerate, broad crypto-market exposure may be exactly what you want.
The problem is not risk itself. The problem is risk that is misunderstood, duplicated, oversized, or inconsistent with your objective. An exposure can be:
- Intentional — It is part of your thesis.
- Unintentional — It appeared through hidden overlap.
- Necessary — It is difficult to avoid while maintaining the strategy.
- A hedge candidate — It is unwanted and can be reduced at a reasonable cost.
How Button helps users understand risk
Button is designed to turn portfolio risk into a conversation instead of another complicated dashboard. The workflow is:
Connect → Understand → Stress → Compare → Act → Monitor
1. Understand the entire portfolio
Button examines positions as a complete system rather than treating every symbol independently. Users can connect positions or provide a symbol list across equities, crypto, and options.
2. Identify the biggest risk factors
Button ranks the factors contributing most to the portfolio's risk. The largest position is not always the largest risk. A smaller leveraged or highly correlated position may be more important than a larger, less volatile holding.
3. Show which positions create each risk
Every risk should answer: "Because of what?"
If technology concentration is high, Button can identify direct stock holdings and indirect exposure through ETFs or options. If crypto-market sensitivity is high, Button can identify the spot and perpetual positions creating it — and whether leverage amplifies the exposure. If an options portfolio has negative gamma or short vega, Button can identify the contracts and expirations responsible.
4. Explain the result at the right level
A non-quant investor might see:
Your portfolio is heavily dependent on large technology companies. A 20% Nasdaq decline could produce an estimated 16% portfolio loss.
A quantitative investor might see:
Mega-cap growth contributes 27% of modeled variance. Market beta is 1.18, with most exposure coming from NVDA, AAPL, QQQ and SPY look-through.
The analysis is consistent. The depth of explanation changes with the user.
5. Show what could happen under stress
Historical statistics describe what happened in the past. Stress tests ask what could happen during a specific event.
For equities:
- What if the market falls 20%?
- What if technology stocks sell off?
- What if rates rise quickly?
For crypto:
- What if correlated assets fall together?
- What if funding rates spike?
- What if leverage creates liquidations?
For options:
- What if the underlying gaps by 10%?
- What if implied volatility rises 20 points?
- What if negative gamma grows during the move?
Button can translate the result into a consequence:
Under this scenario, the portfolio could lose approximately 16%.
That is easier to understand than an abstract risk score.
6. Compare ways to reduce the exposure
Identifying risk is only the beginning. Users also need to understand how the risk can be changed. Imagine a portfolio containing large positions in AAPL and NVDA, plus QQQ and SPY. Button identifies mega-cap growth concentration as a major factor. It contributes an estimated 27% of total portfolio risk. Under an illustrative Nasdaq decline of 20%, the portfolio loses an estimated 16%. The user asks:
Reduce this risk, but show me what I give up.
Button could compare several approaches.
Option 1: Trim AAPL and NVDA
- Benefit: A direct and permanent reduction in concentration.
- Trade-off: Less upside and a possible tax impact.
Option 2: Replace part of QQQ
- Benefit: Less overlapping technology exposure.
- Trade-off: A different portfolio return profile.
Option 3: Buy a QQQ put spread
- Benefit: Downside protection while preserving more upside.
- Trade-off: Premium cost, expiration risk and incomplete protection.
The same process applies to crypto and options. A crypto trader might reduce leverage, close part of a perpetual position, add collateral, or diversify venue exposure. An options trader might adjust delta, buy gamma, reduce short vega, spread expirations, or use defined-risk structures.
Show the portfolio before and after
For every proposed action, Button should show:
| Question | What Button shows |
|---|---|
| How much risk disappears? | Factor exposure, risk contribution, volatility and VaR |
| What does the user give up? | Potential return, upside, taxes and implementation cost |
| Does the portfolio survive stress better? | Before-and-after scenario losses |
| Did the change create another problem? | Liquidity, leverage, basis, concentration or counterparty risk |
The most valuable result is not:
This portfolio is risky.
It is:
This change reduces the selected stress loss from an estimated 16% to 10%, while reducing modeled annual return by 2.6 percentage points.
That is a decision.
From dashboard to decision partner
Traditional risk tools often stop after showing charts. But knowing that you have an exposure is only the first step. For every important factor, Button should answer six questions:
- What is the risk?
- Which positions create it?
- What could happen under stress?
- What choices could reduce it?
- What would each choice cost?
- Which choice best matches the user's objective?
The goal is not to eliminate every risk. Without risk, there is usually no return. The goal is to understand:
- Which risks you own
- Why you own them
- How large they are
- What could make them hurt
- What it costs to change them
Risk factors turn a list of holdings into a map of the portfolio's true behavior. Button turns that map into a decision.
Visit Button and ask:
What are the three biggest risks in my portfolio, which positions create them, and how can I reduce the largest one while preserving as much upside as possible?
Risk exposures, expected returns, and stress losses are model estimates. They are not guarantees of future performance or investment advice.